Elastic Search ELK with BRO IDS filebeat
The
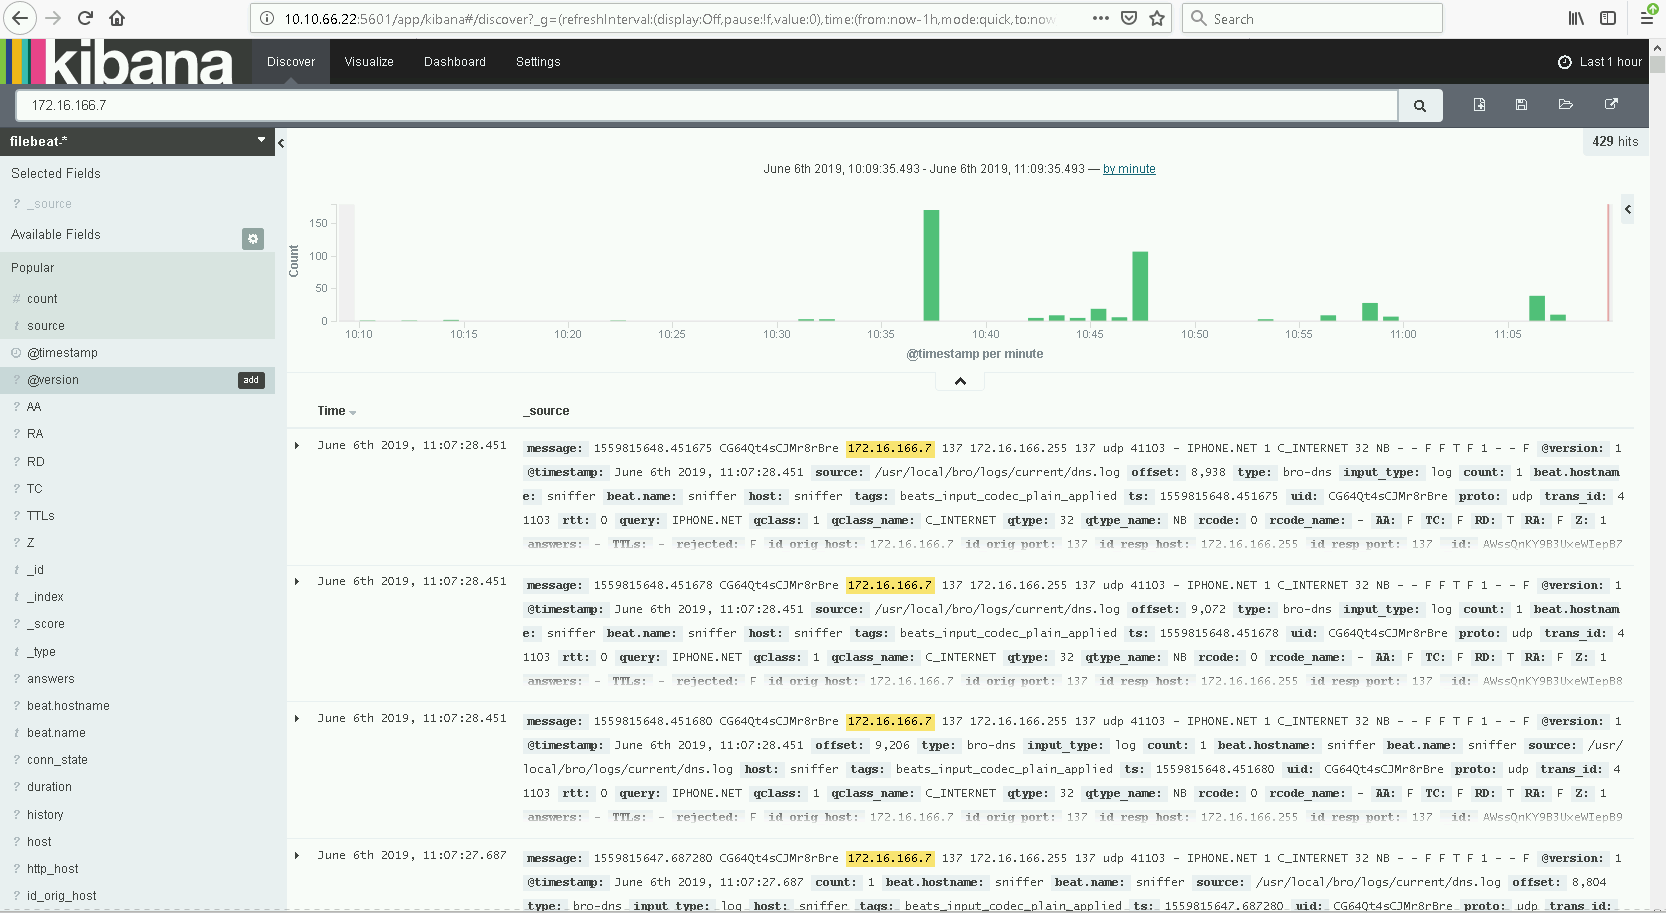
elastic host runs the ELK toolset with kibana web front end. Ensuring
incoming filebeat logs are received and processed is the challenging
part of configuration.
Below are configuration components.
- /opt/kibana/config/kibana.yml --- kibana webhost accessible only field changed (i.e. "1.1.1.1")
- /etc/elasticsearch/elasticsearch.yml --- listening port, paths, config for elasticsearch
- /etc/nginx/conf.d/kibana.conf --- web server config
- /etc/logstash/conf.d/02-beats-input.conf --- ssl cert and port listener config
- /etc/logstash/conf.d/10-bro-conn.conf --- the logfile parser for processing syslog and bro-logs
- Setting env export http_proxy=hxxp://proxy.me.com:3128 may negatively affect elasticsearch.
- /var/log/logstash/logstash.log --- updates on incoming logs from sniffer host
Further logs 
- Full guide in links at bottom of this page.
Malware network Host Detail
Both running on Eclipse, managed via Linux Virtual machine manager application using these settings:
Malware network ELK SIEM host - elastic 10.10.66.12
- The host runs NGINX, Kibana (port 5061), Elasticsearch (port 9200), Logstash (port 5044).
- There are three important configuration files in /etc/logstash/conf.d/ which are input, filter, output.
- /etc/logstash/conf.d/02-beats-input.conf
input {
  beats {
    port => 5044
    ssl => true #just changed to true from false
    ssl_certificate => "/etc/pki/tls/certs/elastic.me.com.net.crt"
    ssl_key => "/etc/pki/tls/private/elastic.me.com.net.pem"
    ssl_certificate_authorities => "/etc/pki/CA/certs/test_root.crt"
    ssl_verify_mode => "force_peer"
  }
}
Use service logstash configtest to test config.
- For each log type to analyse a config file is neeed in /etc/logstash/conf.d/ such as 10-syslog-filter.conf
- For secure filebeat log transfer it needs the root cert CA in /etc/pki/CA/certs/test-root.crt
- It needs the public SSL key in /etc/pki/tls/certs/.crt and the private key in /etc/pki/tls/private/.pem
Use this command to test receiver:
curl -XGET 'http://localhost:9200/filebeat-*/_search?pretty'
Run a test elastic search input logfile
Push setting to ignore malformed
Get config kibana indexing
Best
place to check for errors in handling log processing:
/var/log/logstash/logstash.log. I saw a parsing error, shown below,
caused by logstash needing mutate commands to interpret IP field data as
elasticsearch cannot process IP fields.
Bro IDS host - sniffer 10.10.66.91
- It has the root CA in /etc/pki/ca-trust/source/anchors/test-root.crt
- It needs the public SSL key in /etc/pki/tls/certs/.crt and the private key in /etc/pki/tls/private/.pem
- Configuring the filebeats client to send Bro connection log data
- The logging client runs filebeat with important YAML config file /etc/filebeat/filebeat.yml
- The
prospector section of this yml file is where the meat of the
configuration happens. Here we define the path to the log files which
should be monitored and allows us to set some metadata for the event
based on where it came from. The logging section should be set to help
diagnose issues.
filebeat:
  # List of prospectors to fetch data.
  prospectors:
    # Each - is a prospector. Below are the prospector specific configurations
    - input_type: log
      paths:
        - "/usr/local/bro/logs/current/conn.log"

      fields:
        type: "bro-conn"
      fields_under_root: true
logging:
   level: info
   to_syslog: true
Setup Guides